
Housing in West End
Local Schools & Restaurants — Featured Listings

The neighborhood of West End has a sad history. The Boston Planning and Development Agency (previously designated as the BRA) declared the West End a slum in 1957 and evicted thousands of West End residents before demolishing 41 acres of people’s homes and history.
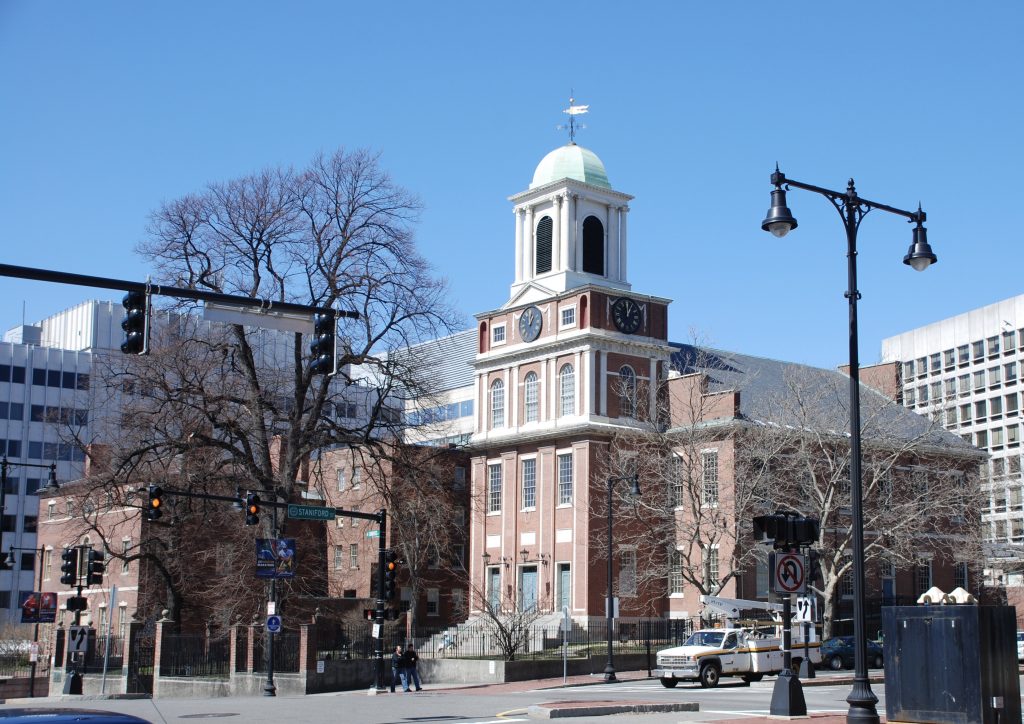
The bounds of West End are roughly the Charles River on the north, Cambridge Street on the west, Causeway Street on the south, and N Washington Street on the east. Within this area lies the West End Historical Museum, TD Gardens, North Station, Mass General Hospital, the Suffolk County Jail, the Museum of Science, and Old West Church.
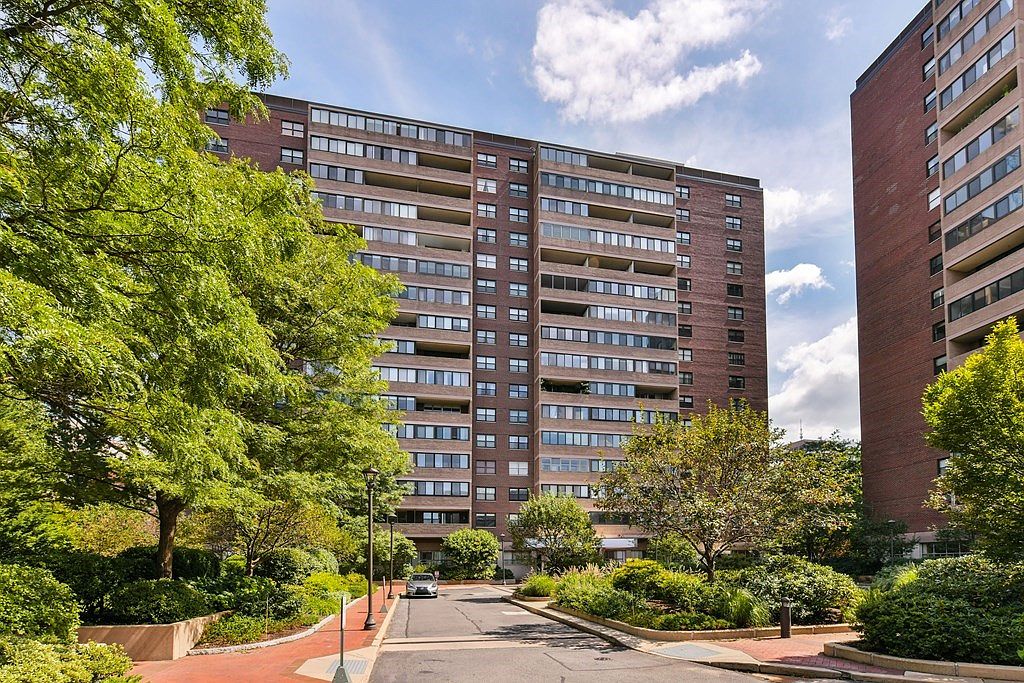
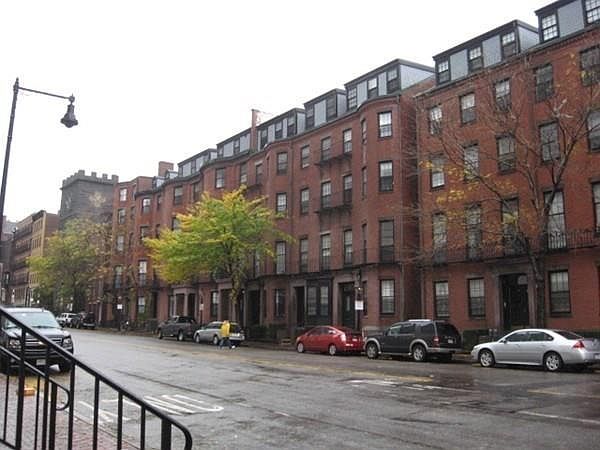
Housing in West End consists principally of condominiums. Many are found in mid-rises and high-rises. The price of condos has been in the range of $419,000 for a small studio to $2,895,000 for a large, 3-bedroom, waterfront unit. Rentals are available from $1600 to $7500 depending upon size, location, and amenities. Real estate markets are very fluid and can fluctuate in a matter of hours because homes can come on and off the market daily… even hourly. What is currently offered for sale is listed below.
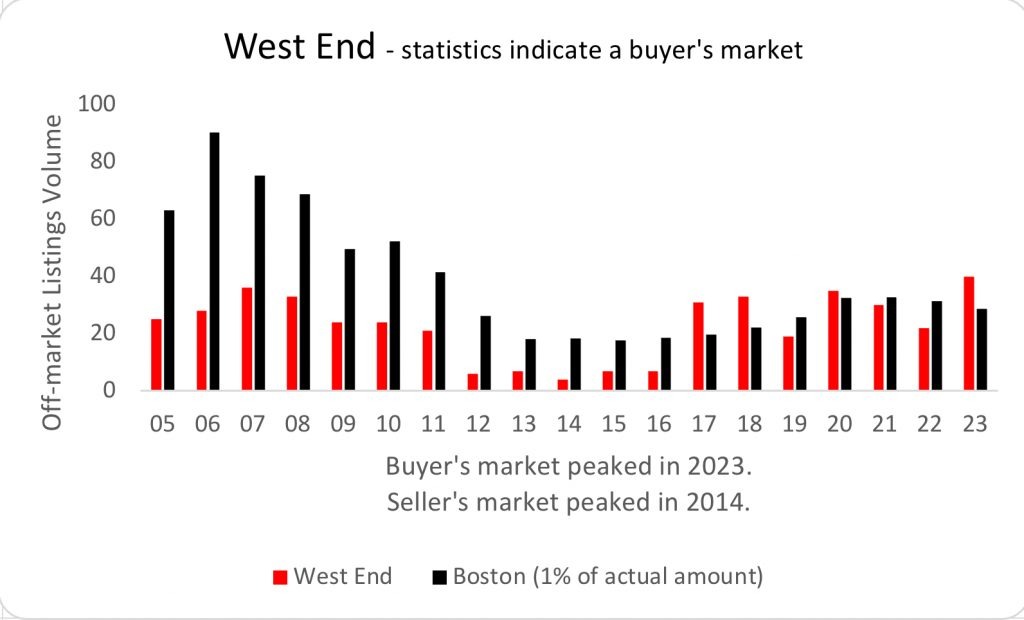
The following chart is a visual representation of the cyclical nature of real estate and compares the ups and downs of West End to those of all of the city of Boston. The taller the column the better it is for buyers. The shorter the column the better it is for sellers. Hence 2007 was the best time for a buyer to buy in West End, while 2012-2016 were great years for sellers. However, buyers will be happy to know that the graphic below indicates a weakening seller’s market.
Area Schools
Great Schools provides ratings for most schools in the United States. Below, you can see what schools are near the address you are thinking of buying and then compare it to other neighboring schools.
This next chart shows the number of sales occurring in West End month-to-month, year-to-year since 2018 and provides you a historical overview of the best times to sell – months with the greatest number of sales (spring and fall) – and the best times to buy – months with the fewest number of sales (summer and winter). CAVEAT: there are usually more houses to choose from in the first half of the year.